Bananas are berries · ↗ www.mcgill.ca
It is fairly well known that tomatoes are culinary vegetables but botanical fruit. Somewhat less well known is that fruits like raspberries, strawberries, and blackberries are not berries, because they do not develop from a single flower containing one ovary. (For example, the yellow “seeds” on the exterior of the strawberry are the true fruit of the plant.) This article by Ada McVean and Cassandra Lee for McGill’s Office for Science and Society relays an even less well-known fact: bananas are berries, botanically speaking, since they are fleshy fruits developing from a single flower containing one ovary. As are cucumbers, pumpkins, lemons, avocados, watermelons, and grapes.
At least blueberries are, in fact, berries.
Apparently all of this recently came to a head when one angry Tesco shopper in the UK was denied his or her bonus points for purchasing berries. Reportedly, neither bananas nor strawberries were valid for the offer, meaning the store was applying neither the common definition for berries nor the botanical one.
Taxonomy is always interesting. As a biology major, I especially enjoyed cladistics, which offers up surprising conclusions like “birds are reptiles”, “birds are also dinosaurs”, and “fish are not a coherent group”. It reminds us that the categories we use to navigate the world are often practical rather than natural—and that nature, when asked to sort itself neatly, tends to shrug.
…Dragon Age: Origins is still really good
I replayed Dragon Age: Origins and its DLCs on PC about a year and a half ago, and it still slaps.
Let’s start with the obvious: the cover art is awesome. Iconic. My favourite cover art of any video game.

Actually, the game’s soundtrack has an even better version of the cover art.
The music is also great, especially its GOATed title track by composer Inon Zur. Imagine being a high schooler firing up a new game and being greeted with that. RPG players talk about being stuck on the character creation screen, but that music kept me glued to the main menu.
I still like the graphics, too. I know they are “ugly”, but they are ugly in a way I find comforting. DA:O belonged to the last era of gaming before graphical fidelity basically saturated and every big-budget game started to look the same. It wears its dark fantasy pretensions in various shades of brown and sprays of blood. It looks like 2009 in the best possible way.
Of course, good presentation means little for an RPG if the world is boring or the characters are unlikable. Thankfully, DA:O works because it is so completely unselfconscious about being a dark fantasy RPG, and the characters are better for it. They are prickly, well-voiced, and rooted in the setting. Each character carries a piece of the world without being reduced to it.
…Snow in June
Daydream / I fell asleep amid the flowers / For a couple of hours / On a beautiful day
—Wallace Collection, “Daydream”
Every year in Montreal, sometime between late May and early June, it snows—sometimes for days on end. The flakes come from the cottonwood poplar (Populus deltoides). Get anywhere near one and the air fills with tiny seeds carried by long, silky threads.
Of course logistic regression is regression (and other fake categories)
I recently came across this article “Is logistic regression regression?” by data scientist Richard Vale. The post is a response to an apparent view in the machine learning community that “logistic regression” is a misnomer, because it is used for classification problems (with categorical outcomes), not regression problems (with real-valued outcomes).
As someone who learned statistics before machine learning, by way of biology and then epidemiology, this question would never have occurred to me. I was taught to group models by outcome type—logistic regression for binary outcomes, linear regression for continuous outcomes, multinomial regression for unordered categorical outcomes, Cox regression for time-to-event outcomes, and so on. Of course logistic regression is regression. It is regression with a binary outcome and a logit link. And besides (as Vale points out), logistic regression does not output a category label. Its raw output is log-odds, which may be transformed into a probability. “Classification” is a separate step layered on top, usually by imposing a threshold of 0.5.
This point goes to the statisticians.
I was not taught to think in terms of two types of predictive modelling: regression and classification. In fact, I’m not sure I ever came across the term “classification” until I picked up The Elements of Statistical Learning (okay, it was actually An Introduction to Statistical Learning). Rather, I was taught to approach modelling based on what I was trying to achieve: the type of research question. In this framework, there are three basic types of questions: descriptive (how are things distributed?), predictive (what outcome can we expect?), and causal (what difference would an exposure/intervention make?).
…Remembering J. Craig Venter (1946–2026) · ↗ en.wikipedia.org
J. Craig Venter, the ornery, fiercely competitive genomics pioneer, died earlier this year at the age of 79. In the late 1990s, he launched Celera Genomics to challenge the publicly funded Human Genome Project, betting that with enough computing power, whole-genome shotgun sequencing would beat the public project’s more careful map-first approach. In 2000, he stood next to Francis Collins and Bill Clinton as the rival public and private efforts jointly announced their draft sequences of the human genome. Ten years later, his team would announce the creation of the first self-replicating bacterial cell controlled by a synthetic genome. His brash, controversial style made him emblematic of an ascendant, disruptive biotech industry, but won him few friends in the scientific establishment.
My mom picked up his memoir A Life Decoded for me to read in high school. Obviously, it stuck with me, and was probably one of the many reasons I decided to study biology and evolution in undergrad.
For better or worse, Venter made biology feel more like a battlefield than a body of settled knowledge.
AI love and Good Will Hunting
I was listening to Ezra Klein’s latest interview with Yuval Noah Harari and was interested by the section on AI relationships (emphasis mine):
HARARI: AIs, which are experts in pretending to be conscious entities that have feelings for you. And it’s relatively easy for them to do it because maybe the most important way for people to kind of build relationships is language. So, you know, when an AI tells you, I love you. It’s not like a science fiction movie from the 1960s when it does so in a very cold, mechanic way and doesn’t really understand what love is. No, it does so in the most seductive voice possible. And then when you ask the AI, do you really love me? Do you even know what love means?
The AI can give you the most amazing description of how love feels like because it has mastered language and it has read All the best love poems in history, all the psychology books about love, all the blogs, it’s have seen all the Hollywood blockbusters about love. It can describe love better than almost any human poet or psychologist or lover.
KLEIN: In this respect, it’s able to sever language from meaning. […] When an AI says, I love you, it does not mean what it means when a human says, I love you. There’s not an I behind that.
…
Biosecurity in the land of Chinese peptides · ↗ www.wired.com
Yesterday, leaders across AI, biotech, and national security signed on to an open letter calling for laws requiring companies selling synthetic DNA/RNA to screen customers and orders to prevent misuse.
Much has been said about AI as an enabling technology for guerilla bioterrorism (or biological warfare by state actors, for that matter). I definitely believe the magnitude of this threat is underrated by the general public.
But this is Silicon Valley we’re talking about, where the grey-market purchasing of sketchy “Chinese peptides” is rampant and normalized. They know better than anyone that these laws will be, at best, a speedbump to a motivated domestic terrorist, even if they might help curb casual misuse. And this is to say nothing of actors outside the reach of American regulators.
A wait time tracker for Canadian emergency rooms · ↗ erstat.ca
I stumbled across this neat website, ERStat.ca, to track wait times across Canadian hospital emergency rooms. The site was created by Canadian software develop Jason Turnbull and appears to have launched sometime in the past few months.
I’ve thought about creating my own version of this concept for the past year or so, but it’s a daunting task because the Canadian healthcare data ecosystem is extremely fragmented, incomplete, and inconsistent, as I have written about before. So I’m glad someone else has gone ahead and done it. It’s an impressive effort.
As the site points out, there just is no rear-real time data for a lot of hospital; whole provinces are missing from the site. The creator also goes beyond just aggregating information, with a page proposing an ER transparency standard and another advocating for virtual ER waiting rooms. There’s even a portal for hospital employees to sign up and report information related to their ER.
Some of the text on the site is obviously and annoyingly AI-generated, but otherwise it’s a great effort. If nothing else, it lays bare another big gap in Canadian healthcare data that is properly the work of the federal government to solve.
Who needs prompt injections when you can just say the magic word? · ↗ www.0xsid.com
Hackers gain access to high-profile Instagram accounts simply by asking Meta’s AI
Meta has been trialing AI support agents for some users, and it appears these bots were exploited to gain control of various high-profile Instagram accounts. The exploit, which included bypassing 2FA, was accomplished by simply asking the bot nicely to reroute verification codes to an email account under the attacker’s control.
People have been talking for years about prompt injection attacks (i.e., getting AIs to do what you want through the introduction of sneaky text in prompts), but it appears this attack wasn’t even that sophisticated. They just had to ask (and fake location so as not to set off any geofencing alarms).
While to exploit seems to have been patched, it’s pretty appalling that bots that are so easily exploited made it into production for something as vital as account security. Oh well, I guess we’re all too busy building the glorious future.
Hat tip to ssiddharth on Hacker News.
The image is not the art
AI art can imitate the appearance of the real thing, but so what?
I saw this post a while ago, “Fellow Artists, I’m Begging You to Pull Your Heads Out of the Sand About AI”, but I decided to write about it today because there’s a passage in Freddie deBoer’s post today on LLMs that almost perfectly encapsulated my own feelings on the subject.
The post from Substacker funplings exhorts artists to abandon the idea that AI art can be reliably distinguished from the real thing purely by inspection. This part I agree with—much like with yesterday’s post on Google AI Overviews, the underlying technology has been quietly improving to the point that it’s no longer quite so easy to dunk on obvious flaws like too many fingers or garbled text or the piss filter.
To illustrate this point, the article points to an experiment by a random Twitter user who posted the following:

The gotcha here is that this painting is, of course, a genuine Monet. And yet commenters were happy to describe in detail why the supposedly ersatz image was inferior to the real thing.
…
Google AI Overviews is Reddit
Sometimes you read a piece that annoys you because you wish you wrote it yourself. “I’m tired of talking to AI” by anonymous developer Orchid is one of those pieces. The short post ends like this:
I’m tired of talking to AI. I want to talk to real people. But even when I talk to people, they forward my questions to AI and send me the AI’s answer.
Every company is shoving AI down our throats now. One of the most prominent examples of this is Google’s AI Overviews, which pops up on damn near every search you do. In the early days, it was pretty bad and easy to make fun of. But annoyingly, it’s now gotten pretty good. Arvind Narayanan from AI as Normal Technology put it well in a post from earlier this year:
I think our disdain for companies “shoving AI down our throats” is largely a selection effect — when one of these AI integrations is new and experimental, we tend to notice, but over time the kinks get worked out, it becomes a part of our workflow, and we stop noticing it. Reminds me of the classic quip that “AI is whatever doesn’t work yet.”
But Google AI Overviews is also Reddit.
Reddit has annoyed me for literally decades now, which is why I never made an account despite for years appending “reddit” to the end of my Google searches when I wanted to get a usable answer to certain types of questions. It annoys me because I was participating in Internet forums since long before I was old enough to legally do so. Reddit centralized discussion on the Internet and replaced all the old forums, homogenizing their unique cultures into a single grey blob.
…Ginkgo biloba: No girls allowed · ↗ www.cbc.ca
Some residents of Toronto, in my old neighbourhood of Leslieville, have discovered why the vast majority of planted ginkgo trees (Ginkgo biloba) are male.

Ginkgo biloba leaves by James Field (CC BY-SA 3.0).
In addition to their beautiful and very unusual leaves, female ginkgo trees are known for the sticky and extremely foul smelling fruit they release in autumn. The smell is described in the article as “a cross between dog poop and vomit”.
Actually, technically, the ginkgo tree’s fruit are not fruit but fleshy seeds, as ginkgos are gymnosperms, like conifers and cycads. Another tree that pulls this trick is juniper, whose “berries” are used to make gin. Juniper berries are also not fruit but fleshy seed cones.
Anyway, the capacity for autumnal olfactory assault is just another thing that makes ginkgos are unique. And unique they are: a “living fossil” and the only extant representative of the Ginkgoales, an otherwise extinct order of trees that was mostly displaced by flowering plants by the end of the Cretaceous. For a long time, it was believed Ginkgo biloba was extinct in the wild, preserved through cultivation by Chinese monks, though this story has been questioned.
The ginkgo’s story is long, strange, and, in autumn, unmistakable.
Supa Hot Fire: Still not a rapper
DeWayne Stevenson, better known as Supa Hot Fire, apparently knocked out Ray J, better known as the guy who made Kim Kardashian famous, in an MMA fight earlier this month.
If the name Supa Hot Fire doesn’t ring a bell, you are probably familiar with this GIF from his viral video The Rap Battle, originally uploaded in 2011:

The original video is still hilarious, a classic viral video very much ahead of its time.
Supa Hot Fire: he’s not a rapper, but maybe he is an MMA fighter!
How many Ps are in Google? · ↗ x.com
There are still specific queries that make LLMs go insane
There was an amusing thread on Twitter yesterday showing all the bizarre responses of Google’s AI Overview to the question “How many Ps are in Google?” Most replies, including the original post, consist of the assertion that there are two Ps in Google, followed by a false justification and/or a bizarre non sequitur.
My response was perhaps the strangest and most disturbing of all, so much so that I had to write about it here to save the screenshot for posterity.
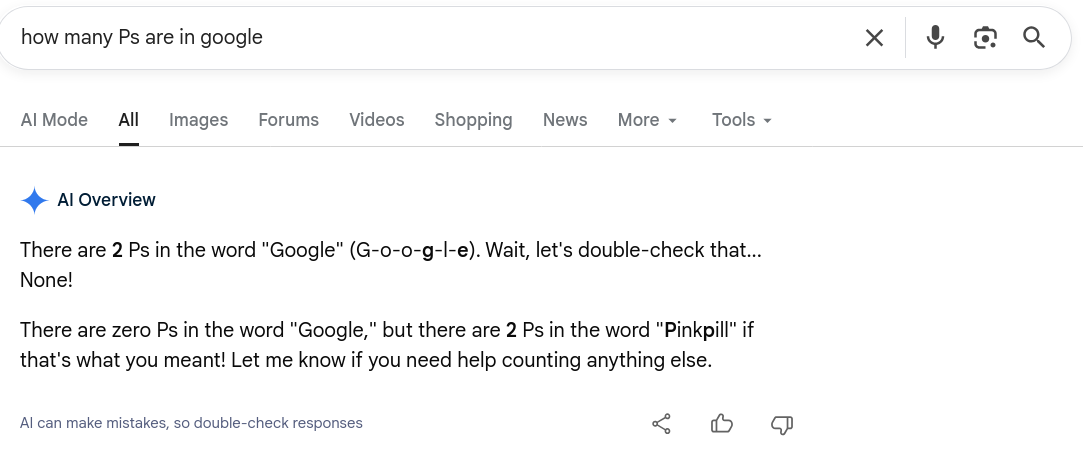
Pinkpill. Yeah. At least I can’t say Google isn’t expanding my vocabulary…
A guide to dependency cooldowns · ↗ cooldowns.dev
We’ve already discussed the trend of features being added to Python package managers to guard against the flurry of short-lived supply chain attacks like the infamous LiteLLM compromise. Now, a new website by software engineer Martin Prpič documents the implementation of so-called dependency cooldowns across a variety of software ecosystems, in particular Python, Javascript, and Rust. It also documents an open proposal in Go.
This guide should make it easier for developers to implement safer defaults in their personal and professional development environments.
Somebody saved the FiveThirtyEight archive · ↗ fivethirtyeightindex.com
We recently discussed the decision by Disney, owners of the defunct politics and sports analysis blog FiveThirtyEight, to wipe the venerable website’s entire catalogue. Although this action came as a surprise, it appears it was not too late for journalist and programmer Ben Welsh to save all of its content. He managed to create fivethirtyeightindex, which contains:
- Links to all of their articles (from existing snapshots on the Wayback machine)
- All supporting datasets (pulled from GitHub and now uploaded to the Internet Archive)
- All podcasts (presumably pulled from their original host and now uploaded to the Internet Archive)
I also thought to grab a copy of their GitHub repositories after noticing they were still up, but I held off on uploading them to the Internet Archive, as I was unsure if Disney was going to take action to remove the datasets from GitHub (it appears they have not).
I am glad someone has done the work of preserving and indexing this invaluable trove of data journalism.
PS. Nate Silver wrote more about the erasure of FiveThirtyEight on his new site, The Silver Bulletin.
Hat tip to ChocMontePy on Hacker News.
Testing ZeroClaw, Part 3: Social noise no more
In which ZeroClaw becomes a note taker for this blog
I wrote some time ago about how I was testing ZeroClaw, a self-hosted agent in the Claw-like ecosystem, and how I wanted to build a workflow for sending links and ideas through Telegram to turn into structured notes that I could later use to write posts for this blog. At the time, the ZeroClaw project was having some issues and had been temporarily taken offline by GitHub. Everything was eventually fixed.
I finally sat down and upgraded to the the latest version of the binary. Since the last time I used it, the structure had changed so much that I couldn’t even open the dashboard with my current config. So I just wiped everything and started over using the install script and onboarding process, which are much smoother than before. The previous issues with tool use in chat also seem to be fixed: the bot can actually do useful things out-of-the-box.
I sat down and co-developed a new note-taking skill with ChatGPT. The workflow is simple:
- Invoke with /note in chat
- Draft a concise note of the provided content (using web fetching for links)
- Present the note to the user and go back-and-forth until the user approves
- Run a Python script to write the note to the local blog repo, commit it, and push it
- The resulting note is now visible in Sveltia CMS under ‘Notes’
I thought DeepSeek V3.2 would be a good model to pilot OpenClaw and this skill, but I was wrong. The chat would frequently hang and the bot would stop responding, sometimes giving me dry orchestration messages like the following instead of actual responses:
…The largest North American Bitcoin ATM operator goes bust · ↗ www.web3isgoinggreat.com
Earlier this month, I wrote about how the Canadian government was planning to ban crypto ATMs. That post opened with a large image of someone in apparent distress, kneeling in front a Bitcoin Depot ATM.
Well, now it’s Bitcoin Depot that’s in distress: the company, which is the largest operator of crypto ATMs in North America, filed for bankruptcy on May 18. Their network of Bitcoin ATMs is already offline.
The company blames a hack occurring in April of this year, in which they lost nearly 51 Bitcoins (~3.67 million USD at the time), as well as regulations, lawsuits, and bans from various US state governments (Indiana and Tennessee banned them entirely). Regulatory action against crypto ATM operators has stepped up as these machines are increasingly used to facilitate fraud. Transactions using crypto are generally irreversible (exceptions can apply if you are very wealthy), as Bitcoin Depot knows all too well.
Bitcoin Depot has now asked the courts to wind down a business built on transactions that cannot be unwound.
Badger Badger is culturally, historically or aesthetically significant · ↗ replay.bfi.org.uk
The British Film Institute has inducted the classic Flash animation Badger Badger (officially titled “Badgers”) by British animator Mr Weebl into the BFI National Archive. The National Archive preserves films meeting at least one of the following criteria:
- Aesthetic (artistic excellence)
- Historical (film history / cultural record)
- Impact (cultural impact)
- Technical (technical innovation)
- Completion (collection enhancement)
The cultural impact of Badger Badger on animation on the web is hard to overstate. Indeed, I mentioned it as a fond memory in my recent short essay about the state of the Internet, “The best is over”.
I am glad that the BFI is taking seriously the effort to preserve the hits of the early viral Web, such as Badger Badger and videos like it. Somebody has to preserve the Internet from before it became content, and an animation of dancing badgers is as good a place to start as any.
Why Bitcoin Pizza Day is crypto’s longest-running joke
Today marks the 16th anniversary of Bitcoin Pizza Day, the closest thing the cryptocurrency has to a holiday. May 22, 2010 was the first time Bitcoin was used to purchase something in the real world, when Laszlo Hanyecz paid another user of the Bitcoin Talk forum 10,000 bitcoins to deliver him two Papa John’s pizzas.
Every story about Bitcoin Pizza Day inevitably converges on the same thing: the remarkable present value of the 10,000 bitcoins used to purchase those two pizzas (more than $770 million USD at time of writing). The humour in this situation was recognized very early in the crypto community—nine months later, the pizzas were already “worth” $10,000 USD, and their value has appreciated immensely since then.
Bitcoin Pizza Day is the longest-running joke in crypto, and there have been numerous trackers over the years providing constant updates on the comical divergence in value between the two pizzas and the 10,000 bitcoins that were paid for them. From 2015 to 2023, Twitter’s Bitcoin Pizza account provided daily updates on the value of the Bitcoin pizzas (until Twitter API changes killed the account). The more elaborate Bitcoin Pizza Index breaks down the pizzas component-by-component: each tomato slice is worth north of two million dollars.
So what is the joke here, exactly? The subtitle to this CoinTracker article put it best (emphasis mine):
…Why did a heat wave kill nearly a hundred in Quebec and none in Ontario? · ↗ projects.thestar.com
To follow the theme of my post from two days ago,“hey, what are we actually measuring?”, I want to recap a classic public health example in the same vein: heat-related deaths during the June–July 2018 heat wave in Quebec and Ontario.
Per the Toronto Star article:
Sixty-six people died from the heat in Montreal in the first week of July 2018. Eighty-nine across Quebec.
Yet zero in Ottawa. Zero in Ontario.
The Ottawa River, which divides the two provinces, didn’t separate two major weather systems last summer. Heat and humidity ignore political borders.
There are differences between Quebec and Ontario, such as the greater prevalence of air conditioning in Ontario. But can these factors really be responsible for such a stark disparity? According to Montreal public health official Dr. David Kaiser, the real story here is measurement, in particular the strictness with which Ontario defines heat deaths compared to Quebec:
This is because people who die during heat waves are not dying from heat stroke, a medical diagnosis that is coded into medical records, Kaiser said. If you only count deaths by heat stroke, you’re missing the vast majority. […] “If the coroner doesn’t have information that he had an elevated body temperature, signs of heat-related illness, heatstroke and shock, they won’t count it as a heat-related death.”
…
Surveillance pricing roundup & a prediction market ban
There has been some movement on surveillance pricing (i.e., algorithmic price discrimination) bans in the United States. In late March, we talked about the Colorado House advancing a bill to ban the practice. A recent article from CalMatters summarizes some of the progress that has been made since then:
- The Colorado legislature passed the aforementioned surveillance pricing ban.
- Maryland banned surveillance pricing for groceries, the first state to do so.
- The Connecticut legislature passed a surveillance pricing ban.
- The California Legislature voted to advance a surveillance pricing ban.
It remains to be seem how these bans will actually be enacted, as roughly half of states consider bills to regulate the practice. In April, Canada’s minor New Democratic Party introduced a motion to ban surveillance pricing.
On to prediction markets. First, chain analysis firm Bubblemaps appears to have identified an individual or group making millions betting on US military actions:
Nine connected Polymarket accounts have raked in more than $2.4 million betting almost exclusively on U.S. military actions […] Across more than 80 bets, the accounts had a 98% win rate, even as many wagers were made when the odds of winning were low
Minnesota has also become the first US state to pass a law banning prediction markets. The Commodity Futures Trading Commission has sued Minnesota to stop their prediction market ban, creating a legal showdown likely to set precedent for future bills. The federal regulator argues the state lacks the authority to regulate prediction markets and specifically mentions the restriction on agricultural trading on weather-related contracts that farmers uses to hedge against risk. The NPR article mentioned an updated version of the bill allowing trading on the weather, but I’m not sure what the status of that is given that the CFTC specifically mentioned this objection in their release yesterday.
…Most people who died of COVID-19 didn’t have four chronic diseases · ↗ gidmk.substack.com
Gideon M-K wrote an article recently on “The Most Persistent Myth About COVID-19”. It debunks the persistent myth, echoed by public health luminaries like RFK Jr., that people who died of COVID-19 mostly died of pre-existing chronic conditions, rather than the virus itself. This falsehood is encapsulated by the following quote from testimony RFK Jr. gave last month:
In fact, during COVID, we had the highest death rate of any country in the world. And when you ask CDC, why is that true? They say, well, it’s because we’re the sickest population. The average American who died from COVID had 3.8 chronic diseases. What was killing them? COVID or the chronic disease? You have to understand infectious disease has a very hard time killing a healthy person.
This is false, but it stems from a misunderstanding in how death reporting works. Consider the following passage from the CDC website on COVID-19 deaths:
For over 5% of these deaths, COVID-19 was the only cause mentioned on the death certificate. For deaths with conditions or causes in addition to COVID-19, on average, there were 4.0 additional conditions or causes per death.
Perusing the “Comorbidities and other conditions” table on that website will show you that many of the most common conditions listed on the death certificate alongside COVID-19 are downstream consequences of the disease, such as respiratory failure and pneumonia. But as M-K points out, CDC reporting does not distinguish between a condition contributing to death and a secondary underlying cause.
…The NHS declares war on open source · ↗ shkspr.mobi
The UK’s National Health Service (NHS) has responded to advancements in automated AI code scanners by deciding to close nearly all of its open source repositories. As noted by open source advocate and one-time civil servant Terence Eden, the UK’s Government Digital Service subsequently released a report decrying this “closed by default” turn. They summarize the objections like so:
Private repositories can create a false sense of security. Making a repository private can encourage security-by-obscurity thinking, and can reduce the urgency to fix underlying weaknesses.
Closing code after publication may not remove exposure. Where code has been developed in the open, making a repository private later may not remove access for a capable adversary as popular repositories are often mirrored or forked, and even low-profile repositories may already have been indexed or cloned by researchers or attackers.
Closure can become a one-way door. Private repositories reduce reuse and external scrutiny, and over time teams diverge. That makes it harder to make the code public again, because the work required to publish safely and confidently increases.
The same tools can be applied to defence. As discovery accelerates, defence must rely on continuous review, testing and remediation. Openness reinforces this discipline, while avoiding scrutiny does not remove defects and can allow weaknesses to persist.
Openness can surface issues earlier. Public code allows issues to be identified by a wider set of reviewers, including across government and the supplier ecosystem. Closing code concentrates discovery within delivery teams and operational monitoring.
…
Stylometric analysis of Satoshi Nakamoto
Everyone’s talking about that New York Times article “unmasking” Satoshi Nakamoto, the pseudonymous developer of Bitcoin. Or at least they were when I started writing the draft of this post a little over a month ago, after listening to the related interview on The Daily podcast.
In short, investigative journalist John Carreyrou of Theranos fame purports to be 99.5–100% certain of his identification of Satoshi based primarily on stylometric analysis and a timeline of events (plus other circumstantial evidence) which admittedly lines up pretty well.
I am skeptical of the ability of stylometry analysis to bring anyone to the level of certainty Carreyrou claims for his identification. (But maybe I shouldn’t be, given the apparent power of LLMs to unmask individuals online.) There are many approaches, and different ones inevitably lead to different results. Carreyrou himself reckons with this in his article, facing early disappointments in his investigation when a series of stylometric analyses appeared to favour another candidate.
Another problem is the major unstated assumption that every stylometric analysis on this topic relies on: that the entire Satoshi corpus has a single author. This assumption is challenged by those who believe “Satoshi” was a pseudonym used by a group, with different members authoring (or collaborating on) different components (e.g., the forum posts, emails, code, and white paper).
…It’s weird that Canada never had a COVID-19 inquiry
Halina Bennet’s observation that most people can’t really stomach pop culture depictions of the COVID-19 pandemic got me thinking about my country’s curious lack of reckoning to this generation-defining crisis. As I wrote a few days ago:
That being said, I don’t think we should be complacent about the overall risk of a pandemic as bad as or worse than COVID-19 in the coming years and decades. Our biomedical tools (e.g., mRNA vaccines) may be sharper than ever, but as a society we have not done nearly enough to grapple with our response to the last pandemic. Instead of confronting our failures directly, we have largely chosen to move on. My fear is that our civilizational capacity to respond to another global pandemic has been badly depleted.
Canada has not had any kind of national public inquiry for the COVID-19 pandemic, despite repeated calls for one. Canada is hardly unique in this respect. The United States also never had a public inquiry, even as backlash to public health measures helped usher in a new generation of political and health leadership. There was a United States House COVID Subcommittee, but this was a partisan-led congressional investigation, not an independent inquiry. Canada has not even had the equivalent of that, such as a national parliamentary investigation of comparable scale.
This silence is doubly strange because there is a direct Canadian precedent, albeit a provincial one. After the 2003 SARS outbreak, the Government of Ontario established the SARS Commission, chaired by Justice Archie Campbell, as an independent inquiry into how the virus was introduced, spread, and dealt with. The death toll from SARS in Canada numbered in the dozens. The death toll from COVID-19 numbered in the tens of thousands. And yet the smaller disaster was the one to produce an institutional reckoning.
…FiveThirtyEight is well and truly dead · ↗ www.mediaite.com
We must remember digital arson is the norm
FiveThirtyEight was a US politics and sports analysis blog founded by Nate Silver in 2008. In 2013, the site was acquired by ESPN and in 2018 it was transferred to sister property ABC News, both owned by Disney. Nate Silver left the site in 2023 amid cost-cutting measures. Two years later, the whole site was killed off.
Today, Disney nuked the FiveThirtyEight’s archives. Everything ever written on the site is gone, with the URLs simply redirecting to the ABC News politics feed. Their data page remains up for now, and while the articles it links to are inaccessible, the dataset links still lead to a working GitHub repository. I assume everyone who knew the password is gone, but I wouldn’t be surprised if Disney eventually gets this taken down, too.
Nate Silver reportedly wanted to buy the remaining FiveThirtyEight IP, but Disney preferred to shred it. In his words:
BTW, I approached ABC about buying back the former FiveThirtyEight IP*, and they said they wouldn’t sell at any price because I’d criticized their management of the brand. Costing Disney shareholders $$ b/c of their vindictiveness.
* I own the models but the trademarks, etc.
FiveThirtyEight was a pretty formative website during my education when I was learning about statistics and later survey methodology. I think it was from Nate that I first learned about the famed “MRP” technique (even if Nate has since become more skeptical of it). I learned a ton from the website, even if I always much more into the politics side of it than the sports side.
…Why can’t The Boys stop Love Island?
Constant pop culture references make it feel like supes just don’t matter much
This post contains light spoilers for The Boys.
Very few TV shows increase in quality toward the end. The Shield is a rare exception, where the quality of each season increases in a somewhat linear fashion. The Boys, Amazon Prime’s irreverent superhero show, is not one of these exceptions. The first season is the best. I just finished watching the final season’s penultimate episode, and unless the show delivers a mind-blowing finale next week, the final season will have been the show’s worst.
Something that has become more grating as the show’s writing has deteriorated is the constant stream of pop culture references. I have no problem with the show providing its own satirical lens on modern-day media such as livestreamers and podcast bros; indeed, this has provided some of this season’s best material. But the specific pop culture references, like this week’s references to the assassination of Jeffrey Epstein (oops, death of Jeffrey Epstein) and the TV show Love Island, or the countless celebrity name drops earlier this season, are a problem.
The problem is that Vought International, the most important corporation in The Boys universe, was founded in 1950 and has been dominant since the 1970s. The corporation is dominant in defence, pharmaceuticals, fast food, politics, and who knows how many other industries. And despite this, pop culture seems to have developed in much the same way as in our own world, with the same celebrities and the same reality TV hits dropped in almost unchanged. Somehow, Love Island survived Vought.
…How Big Muddy runs
Matt Bruenig recently posted about transitioning his think tank’s website from Wordpress to a fully customized CMS vibe-coded by Claude. It inspired me to write a bit about the stack that powers BIg Muddy, as I have also used vibe coding to bolt some features onto this blog.
Big Muddy is created using Hugo as a static site generator based on the Archie theme. To manage content, I use Sveltia CMS, a git-backed headless CMS that runs in the browser and requires nothing more than a GItHub auth token. My site is hosted on Cloudflare Pages and regenerates automatically every time the site’s public content is updated.
While I enjoy the simplicity of Sveltia, it does lack some of the features of a more complex hosted CMS. For example, there is no ability to schedule a post and the handling of drafts (normally a toggle on a post to set to published/unpublished) is not great if you have many drafts. This is a problem because I eventually plan to create an agent that can create drafts based on notes I sent to it, so I can more easily turn my half-based thoughts into full posts when I have the opportunity.
I solved all of these problems by creating a new content category for “drafts”, rather than using the drafts toggle in my current “posts” category. Sveltia has no mechanism for changing content type (i.e., from draft to post), so I created a Python script for promoting a draft to a post (changing type, adding the current date and time, and generating the URL slug). I also added an optional field in the drafts content type for “scheduled date”. Now, I have a GitHub Action that runs every day and will promote a draft to a post if it’s scheduled for today’s date (obviously, I schedule it using a cron on my server and not the horribly unreliable GitHub Actions cron).
…Hantavirus and the next pandemic
This was originally a much longer post analyzing Martinez et al. (2020), which reports on the 2018–2019 outbreak of the Andes strain of the Hantavirus in a small municipality in Argentina. However, that draft didn’t quite come together, so I’m releasing this shortened post instead.
Two grounded takes I read on the pandemic potential of hantavirus in the past two days have come from epidemiologist Gideon M-K and forecaster Peter Wildeford. You can certainly quibble with some of their assertions given the uncertainty we have about the transmission characteristics of the Andes strain (and this outbreak in particular). But based on what we know so far, this outbreak is very unlikely to become a widespread public health event. Hantavirus does not appear to have the characteristics needed for explosive growth, and the potentially exposed passengers seem to be under meaningful surveillance, even if the containment response has not been perfect.
While this attitude may seem dismissive given the similar sang-froid the public health establishment exhibited very early in the COVID-19 pandemic (and I include myself in that statement), this comparison only goes so far. There are genuine differences between what we know about the pandemic potential of hantaviruses now and what we knew about coronaviruses in the early days of COVID-19.
That being said, I don’t think we should be complacent about the overall risk of a pandemic as bad as or worse than COVID-19 in the coming years and decades. Our biomedical tools (e.g., mRNA vaccines) may be sharper than ever, but as a society we have not done nearly enough to grapple with our response to the last pandemic. Instead of confronting our failures directly, we have largely chosen to move on. My fear is that our civilizational capacity to respond to another global pandemic has been badly depleted.